Linking Surface Monitors, Satellite Data, and Emissions Inventories to Investigate Regional Haze Trends in the Eastern U.S.
Collaborative project between LADCO and Argonne National Lab to investigate the connections between changes in emissions and regional haze in the Midwest and East U.S.
Presentations
2018 AGU Fall Meeting Presentation
Data Sharing
Google Drive folder for sharing project files:
Continuous Emissions Monitor (CEM) Emissions Trends
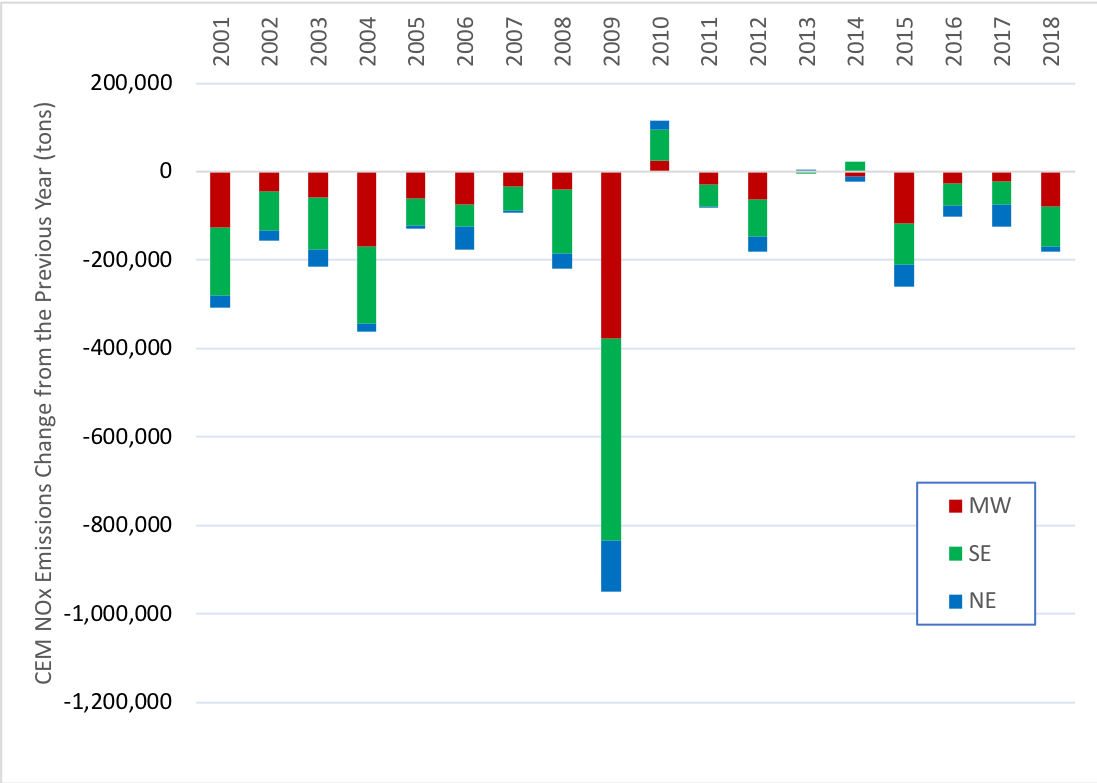
The plots here show the changes in CEM NOx and SO2 from 2000 through 2018. The data to generate these plots were downloaded from the EPA Air Markets Program Data website.
State Total CEM SO2 Emissions
State Total CEM SO2 Emissions Differences
Regional CEM SO2 Emissions Trends
MJO CEM SO2 Emissions Trends
State Total CEM NOx Emissions
State Total CEM NOx Emissions Differences
Regional CEM NOx Emissions Trends
MJO CEM NOx Emissions Trends
National Inventory Sector Emissions Trends
The plots here show trends in national and regional emissions from 2000 through 2017. The data to generate these plots were downloaded from the EPA National Emissions Inventory Air Pollutant Emissions Trends website.
NOx Emissions Trends
SO2 Emissions Trends
PM2.5 Emissions Trends
NH3 Emissions Trends
Call Notes
Notes
- Donna’s plots are for April-September showing total extinction, and extinction by carbonaceous aerosol species; more scatter in the northwestern regions than elsewhere, attributable to fires (?)
- Need to focus on testing our hypothesis proposed for the AGU paper: reductions in EGU NOx and SO2 = reductions in haze in the east
- Clear reductions in haze to the research community, is it also clear to the policy community?
- Do analysis to remove fire signal in haze trends, quantify reductions with and without fires: what is the anthropogenic haze trend relative to the total haze trend? conversely, what is the natural/background haze trend?
- For trends should look back to 2002 forward; LADCO to define regions: upper midwest, northeast, south; use state boundaries, not geog coordinates
- New IMPROVE algorithm attempts to separate anthro vs natural background/haze; can we use this distinction for looking at the remote sensing data?
- Dan interested in recreating surface extinction vs satellite AOD, per the paper he forwarded; look at more recent years and subregions defined by LADCO
- Should we look at other networks, like gas phase or urban PM? No, lets stay focused on IMPROVE for now
- Create plots/analysis items and then meet again in November to craft the story about the EGU trends and connection to visibility in the East
- Zac will create a Google Drive folder for sharing
- Next Call: Monday November 5 @ 10:00 Central
Action Items
- Dan: replicate correlations between AOD and surface extinction (reconstructed IMPROVE); once algorithm is developed, we can parse across different dimensions (dates, locations, species)
- Donna: send Dan IMPROVE data
- Donna and Zac: define map of analysis regions (upper midwest, NE, South)
- Zac: create plots of emissions trends
- Donna: develop IMPROVE trends plots by region, across different species, and anthro vs natural
- Zac: create Google Drive for sharing files/data/plots


